The Support Break That Changes the Narrative
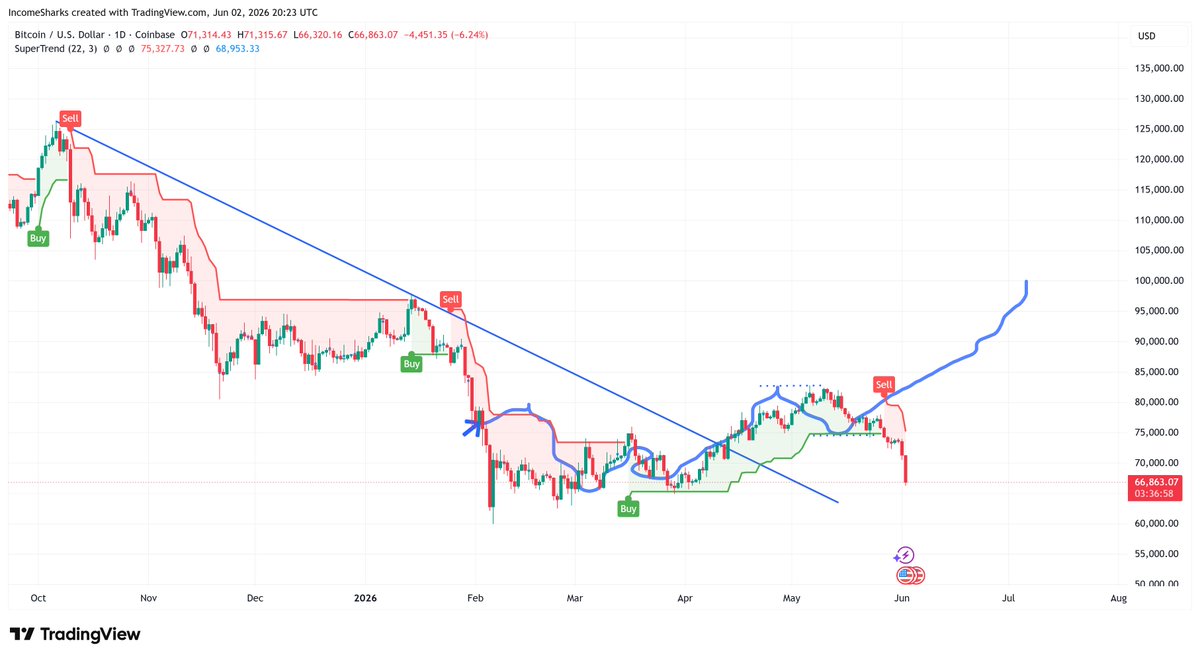
$BTC has lost a level that bulls needed to hold. The breach of the $67,200 zone — which had been acting as a consolidation floor over the prior sessions — shifts the short-term chart structure from neutral to distributive. This isn't a wick below support; price is printing and holding beneath it, which is structurally different.
Volume accompanying the move is significant: $65.7B in 24-hour trading confirms this isn't a low-liquidity shakeout. Aggressive selling with that kind of participation suggests institutional repositioning, not retail noise.
Fibonacci Confluence and the Next Demand Zones
Pulling the Fibonacci retracement from the Q4 2023 lows to the March 2024 highs, the 0.618 level sits near $62,400 — a magnet that price structures tend to gravitate toward after breaking key horizontal support. Between current price and that level, there's a secondary horizontal zone around $64,800, which aligned with the January breakout range.
If $64,800 fails to hold on a retest, the path to $62,400 opens with minimal structural resistance. Conversely, any recovery attempt needs to reclaim $67,200 on a closing basis before bulls can argue the breakdown was a false move.
ETH Confirms Broad Weakness — Not a BTC-Isolated Event
$ETH's 5.13% drop to $1,900.29 with $20.1B in volume tells a parallel story. The $1,900 level is psychologically significant, but technically, the more critical zone is $1,850 — where the 200-week moving average has historically provided macro-level support.
$ETH has been underperforming $BTC on a relative basis through most of this cycle, and a breakdown in the ETH/BTC ratio during a BTC pullback typically accelerates ETH's drawdown. Traders watching ETH need to monitor whether $1,900 holds as support on the daily close, or whether a flush toward $1,780–$1,820 becomes the path of least resistance.
The Macro Divergence Problem
The technical damage is compounded by the macro context. Equity markets have been trending higher, with risk appetite broadly intact across traditional asset classes. Crypto declining in parallel with a strong stock market removes the "macro headwinds" explanation — this is a crypto-specific structural failure.
When high-beta risk assets like $BTC fail to participate in a risk-on environment, it signals internal market weakness: likely a combination of overleveraged long positions being cleared, spot selling from short-term holders, and reduced conviction from momentum participants. The RSI on the daily $BTC chart, now approaching the 38–40 range, is not yet oversold — meaning there's no technical floor from momentum exhaustion yet. A move into the 30–35 RSI band would begin to attract mean-reversion interest, but that corresponds to lower prices from here.
Key Takeaways
- $BTC has broken below the $67,200 support level on elevated volume ($65.7B), shifting short-term chart structure to bearish
- The next meaningful demand zones are $64,800 and the 0.618 Fibonacci level near $62,400 — both need monitoring on any continuation lower
- $ETH at $1,900.29 is testing a psychological floor; the $1,850 zone represents the next hard technical support
- Daily RSI on $BTC is approaching 38–40 but is not yet in oversold territory, limiting the case for an immediate bounce
- The divergence between a strong equity market and crypto weakness points to internal structural selling rather than macro-driven pressure
Want Daily Intelligence Like This?
Inside The Vault, members get live liquidity maps, daily trade setups, weekly recaps, and a private community of serious traders.
Unlock The Vault